Technical Analysis for beginners in Stock Market Trading

Technical analysis is a way to study the history of security to predict its future price. It is one of the most reliable ways to determine what the market thinks about security.
Technical analysis can be used for predicting the future behavior of an asset, and it helps traders make more informed decisions. This article will provide some basic information about technical analysis and how to use it in your trading.
Technical analysis is the study of past market data to predict future prices. Technical analysts usually use charts to analyze stocks, futures, commodities, and currencies. They look for patterns in trading volume, price changes, and other information that might help predict future trends. In the stock market, chartists study the price of a stock over time to identify potential areas for growth or decline. Technical analysts may also use charts to predict trends affecting industry-wide movements. These data may include How many calls a company receives annually and the distance from the current price to its highest point in the past six months.
How Technical Analysis Works
Technical analysis is a type of trading that is based on studying past price movements and future predictions. It is primarily used to predict the direction of a market or asset, help predict support and resistance levels, and identify potential targets for buy or sell orders. Most traders use technical analysis as a tool to make more informed decisions about the stock market. Technical analysis is a discipline that studies past price movements and future predictions based on these data.
How to Read a Chart
Traders use technical analysis as a technique to evaluate securities by analyzing the statistics of their price movements. Technical analysts use charts to identify patterns, which they interpret as buy or sell signals. The analysis assumes that all information about a security is reflected in its price movement.
Types of charts
Line chart
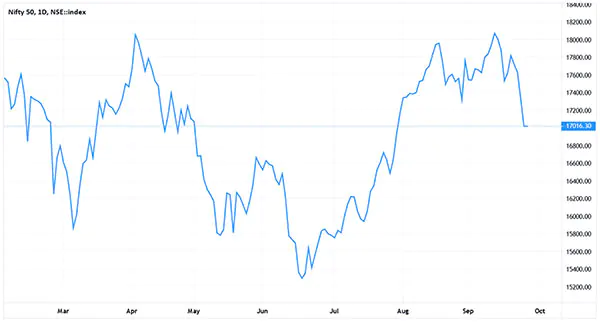
A line chart is a type of chart that plots two or more series of data as a series of points joined by straight lines. The data points are plotted on the horizontal axis, and the corresponding values are on the vertical axis. Line charts compare changes in value over time, such as changes in stock prices.
Bar chart
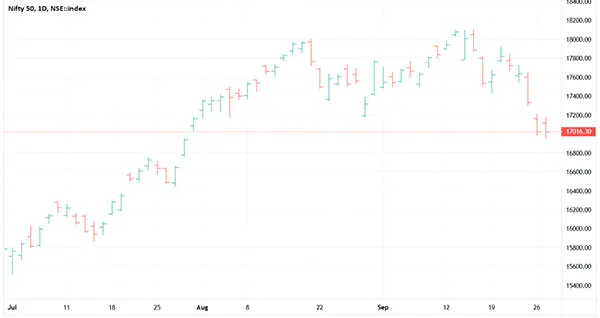
A bar chart uses vertical lines with horizontal lines spouting out rather than just a dot. This makes it much more informative than a line chart. The top of each line in a body signifies the day-high price of the stock, while the bottom point denotes the day-low. The horizontal line at the left means the price at which stocks opened today. The rightmost mark on a bar chart shows you the trading price of an asset at the end of the day.
Candlestick chart
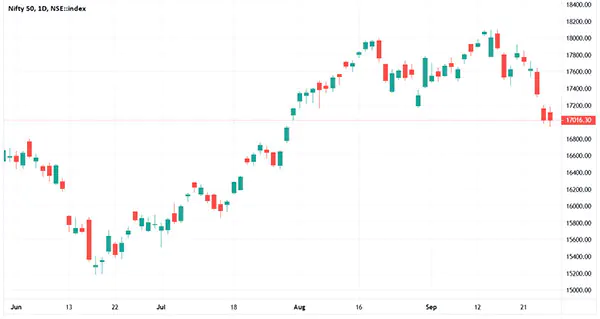
Candlestick charts are financial charts that show a security's opening, closing, low and high prices over time. A candlestick chart comprises two parts: the body and the shadows. The body of a candlestick denotes the opening and closing prices, while the shadows represent the high and low prices. A hollow or filled part of a candlestick signifies that the closing price was lower or lesser than the opening price, indicating a bearish trend. A solid part of a candlestick represents that the closing price was higher or greater than the opening price (a bullish trend).
What Is Support & Resistance
Support and resistance stand as two fundamental concepts in technical analysis. Support is a level at which the price tends to find buyers, and resistance is a level at which the price tends to find sellers. The support level is where most traders place their stop-loss orders because it is seen as the level at which a stock is expected to stop falling.
On the other hand, The Resistance level is where many traders place their limit orders because it is seen as the point where a stock will stop rising.
Indicators
Indicators are technical analysis tools that display the current direction of a market. Traders use these indicators to identify potential trends and make profitable trades.
Many different types of indicators can be found in technical analysis. These indicators are used to measure the strength or weakness of an asset. The most popular indicators include the Moving averages, MACD, RSI, Bollinger Bands, Stochastic Oscillator, etc.
Trend lines
Trend lines are a type of technical analysis that can be used to identify the general direction of a stock. Trend lines are drawn on a chart and show the general movement of a stock over time. This can help determine whether to buy or sell stocks.
A trend line is drawn by connecting two or more points on a chart, which are typically at least three points. The line can be drawn using various methods, such as connecting closing prices and moving averages or highs and lows. Trend lines can also identify support and resistance levels for stock prices, which traders use when considering buying or selling stocks.
Chart Patterns
Continuation Patterns:
Continuation patterns in technical analysis represent temporary pauses within an existing trend, suggesting that the prevailing market direction will likely persist once the pattern resolves. These patterns, such as flags, pennants, and triangles, offer valuable insights into the market's behavior, indicating a consolidation phase before the trend resumes.
For instance, flags are characterized by parallel trendlines, showcasing a brief pause in price movement before continuing the primary trend.
On the other hand, Pennants resemble small symmetrical triangles and signal a brief consolidation before the trend continues. Recognizing and interpreting these continuation patterns is crucial for traders as they provide entry and exit points, aiding in maximizing profits within the ongoing trend.
Reversal Patterns:
Reversal patterns serve as vital indicators of a potential change in the existing market trend. These patterns, including
- Head and shoulders
- Double tops
- Bottoms
It signify a shift in market sentiment, indicating the possible end of the current trend.
For instance, the Head and Shoulders pattern consists of three peaks: a central peak (head) flanked by two lower peaks (shoulders). This pattern often indicates a reversal from an uptrend to a downtrend.
Similarly, Double-tops and Bottoms illustrate a market attempting to break through a previous high or low but failing, signaling a probable reversal. Recognizing these reversal patterns assists traders in anticipating trend shifts, enabling them to adapt their trading strategies accordingly to capitalize on new market directions.
Conclusion
In conclusion, for beginners diving into stock market trading, mastering technical analysis is like learning the secret language of the market charts. It's the key to understanding trends, patterns, and potential opportunities to make informed trading decisions. Beginners can gain a solid foundation by grasping basic concepts like support and resistance, using indicators wisely, and recognizing patterns.
However, it's important to remember that practice and continuous learning are crucial. Technical analysis isn't a crystal ball, but it provides traders with valuable tools to navigate the complexities of the stock market. So, stay curious, keep learning, and use these tools wisely in your trading journey.