Candlestick Overview in Trading
Introduction
Candlesticks are crucial visual tools in trading, providing investors with insightful glimpses into market dynamics. These simple yet powerful representations of price movements have become essential for traders. A candlestick is a graphical representation of an asset's price movement during a specific time-frame, typically displayed on trading charts. Understanding the basics of candlesticks is essential for trader, as it lays the foundation for interpreting market trends and making informed investment decisions.
Definition of Candlesticks
In trading, a candlestick visually represents price fluctuations over a given period. Each candlestick has two main components: a rectangular-shaped body and thin lines known as wicks or shadows. The body represents an asset's opening and closing prices, while the wicks indicate the high and low prices during the same time-frame. Candlesticks come in various colors, with green or white typically denoting bullish movements (price increases) and red or black indicating bearish movements (price decreases). This straightforward color scheme simplifies the interpretation of market trends for traders.
Historical Evolution of Candlestick Charts
The origins of candlestick charts can be traced back to 18th-century Japan, where rice traders used them to analyze price patterns. The technique, known as candlestick charting, was later introduced to the Western world by an expert, Steve Nison, in the 1990s. Its extensive use can be attributed to its clarity of complex market data. Initially applied to the rice market, candlesticks have since become a universal tool applicable to various financial markets. The historical evolution of candlestick charts underscores their enduring significance and adaptability, making them an invaluable asset for traders navigating modern markets.
Importance in Modern Trading
In the financial markets, candlestick charts have become a staple for traders of all experience levels. Their importance lies in their ability to convey information concisely and visually comprehensibly. Candlesticks are not merely aesthetic additions to trading platforms; they are dynamic indicators that assist in recognizing market trends, potential reversals, and entry/exit points. Modern trading strategies often incorporate candlestick patterns as integral components, emphasizing their role in fostering informed decision-making. As we delve deeper into the intricacies of candlestick patterns, their significance in modern trading will become increasingly evident for beginners looking to enhance their understanding of market dynamics.
Formation of a candlestick
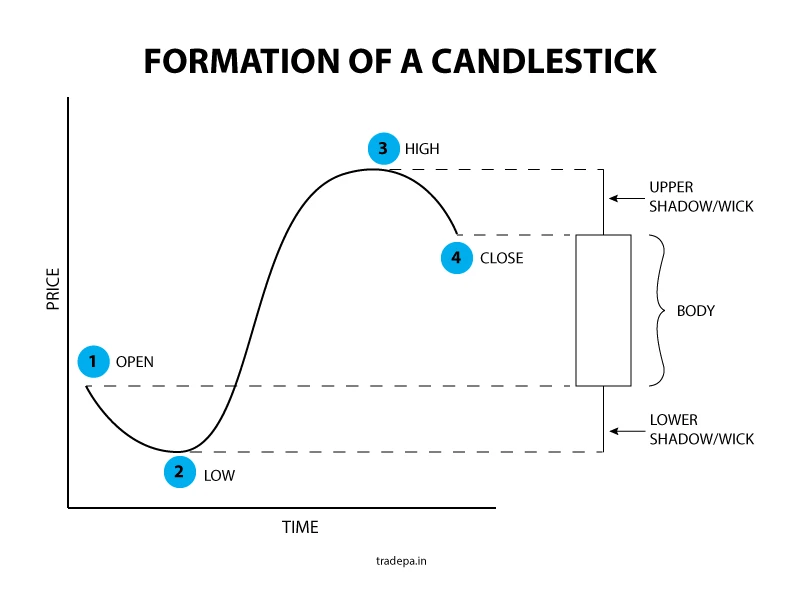
The formation of a candlestick on a price chart is a visual representation of an asset's price movement during a specific period, such as an hour or a day. This fundamental element in technical analysis comprises four key reference points: the opening price, marked as "1 - Open," the lowest price during the period, marked as "2 - Low," the highest price reached, marked as "3 - High," and the closing price, indicated by "4 - Closed."
The rectangular body of the candlestick encapsulates the range of prices between the open and close prices. At the same time, the upper and lower wicks or shadows extend to represent the highest and lowest prices, respectively. The color of the candlestick, often green or white for bullish movements and red or black for bearish movements, provides a quick visual cue about the dominance of buyers or sellers during that time-frame. Understanding the formation of a candlestick is foundational for traders, offering valuable insights into market sentiment and potential trends.
1. Opening Price (1 - Open):
At the start of the hour, the market opens, and the asset begins trading at a particular price. This opening price is represented by the reference point labeled as "1" on the chart. The bottom of the rectangular body of the candlestick corresponds to this opening price.
2. Lowest Price (2 - Low):
As the hour progresses, the asset's price fluctuates, and at one point, it reaches its lowest level during that hour. This lowest price is indicated by the reference point labeled as "2" on the chart. The lower shadow or wick of the candlestick extends down to this lowest point.
3. Highest Price (3 - High):
Simultaneously, the price also reaches its highest level during the hour. The reference point labeled as "3" on the chart represents the highest price. The upper shadow or wick of the candlestick extends up to this highest point.
4. Closing Price (4 - Closed):
At the end of the hour, the market closes, and the asset settles at a specific price. This closing price is represented by the reference point labeled as "4" on the chart. The top of the rectangular body of the candlestick corresponds to this closing price.
Now, let's interpret the candlestick based on its color:
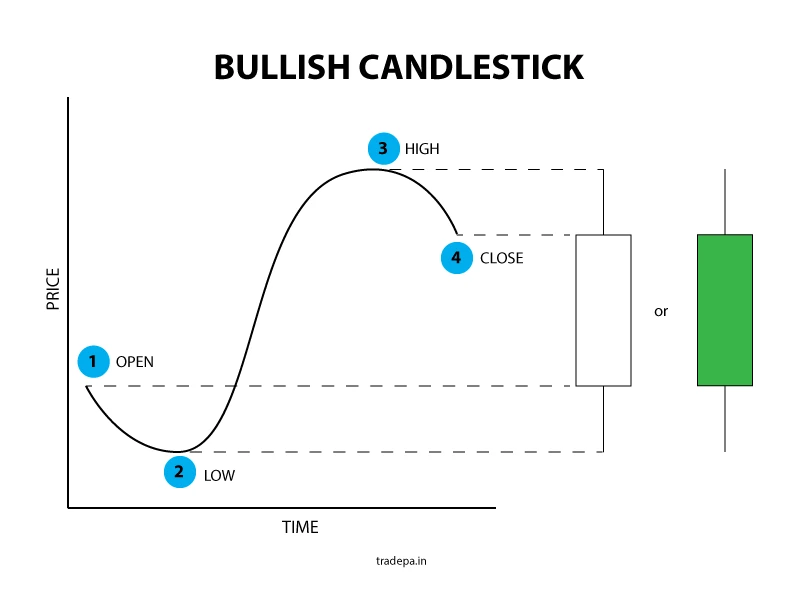
If the closing price (4) is higher than the opening price (1), the candlestick is likely colored green or white, indicating a bullish movement.
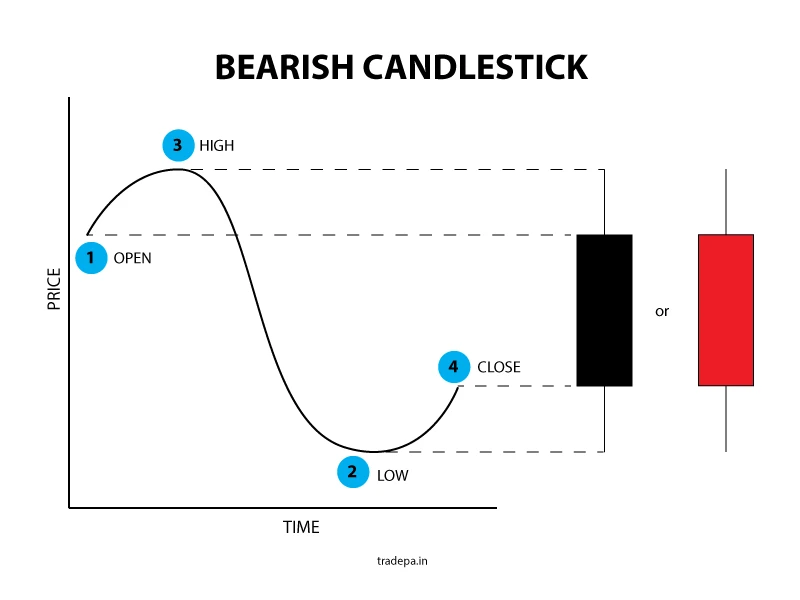
If the closing price (4) is lower than the opening price (1), the candlestick is likely colored red or black, indicating a bearish movement.
Understanding these reference points allows beginners to interpret the visual cues of a candlestick chart. The body of the candlestick provides a quick snapshot of the opening and closing prices, while the shadows signify the highest and lowest prices during that specific time-frame. This basic knowledge lays the foundation for more advanced candlestick pattern analysis as beginners continue trading.
Why is a candlestick used instead of a price line?
Candlesticks are used instead of simple price lines for several reasons, and each has its advantages. Here are some key reasons why candlestick charts are often preferred over price lines in trading analysis:
1. Comprehensive Information
- Visual Representation: Candlesticks provide more information than a simple price line. Each candlestick shows the closing price and includes the opening, high, and low prices for the specified time period. This additional data helps traders understand the full spectrum of price movements within that time-frame.
- Quick Assessment: The body and wicks of a candlestick offer a quick visual summary of the market sentiment. Traders can quickly identify whether the price increased (bullish) or decreased (bearish) and the extent of the price range.
2. Market Psychology
Candlesticks convey the psychology of market participants. Patterns such as doji, hammer, or engulfing provide insights into potential trend reversals, market indecision, or strong momentum. This psychological aspect is crucial for traders looking to anticipate future price movements.
3. Trend Analysis
Candlestick patterns help traders identify trends and trend changes more effectively than a simple price line. Certain candlestick formations, like the trend-reversal or continuation patterns, offer valuable clues about how an asset's price will likely move.
4. Time Sensitivity
Candlesticks are particularly useful for traders focusing on specific time-frames. The open, high, low, and close data within each candlestick provide a snapshot of price action over that chosen time-frame, helping traders make decisions based on their preferred time horizon.
5. Historical Context
Candlestick charts facilitate the comparison of current price movements with historical patterns. Traders can quickly identify recurring patterns and make more informed decisions based on how similar situations have unfolded.
6. Widely Accepted
Candlestick charts have become a widely accepted industry standard. Traders across different financial markets use them, leading to a shared understanding and interpretation of various candlestick patterns. This universality fosters effective communication and analysis among traders.
In summary, while price lines offer simplicity, candlestick charts provide a more detailed and nuanced view of price movements, incorporating crucial information for traders. The ability to assess market sentiment, identify trends, and recognize patterns makes candlestick charts a preferred choice for those seeking a comprehensive and insightful approach to technical analysis in trading.
Candlestick Patterns in Different Markets
Understanding how candlestick patterns apply to various markets is crucial for traders seeking to broaden their expertise. Candlestick analysis transcends asset classes, and each market has its unique nuances. Let's explore how candlestick patterns unfold in different financial arenas.
1. Forex Market
In the dynamic realm of the Forex market, candlestick patterns play a pivotal role in guiding trading decisions. The patterns that indicate trend reversals, like the "Engulfing Pattern" or the "Doji," are particularly significant. For instance, a bearish engulfing pattern in the Forex market might suggest a potential shift from an uptrend to a downtrend. Traders in the Forex market usually rely on candlestick patterns to discern entry and exit points, taking advantage of the 24-hour nature of Forex trading.
2. Stock Market
Candlestick patterns are equally applicable and valuable in the stock market. In this realm, patterns such as the "Double Top" or "Double Bottom" can indicate potential trend reversals. For example, a double-top pattern may signal that a stock's upward momentum is waning, possibly paving the way for a downtrend. Traders in the stock market often use candlestick patterns to make informed decisions on buying or selling shares, aligning their strategies with the prevailing market sentiment.
3. Futures and Options
In the futures and options trading, candlestick patterns provide insights into market expectations and potential price movements. Patterns like the "Bullish Harami" or "Bearish Harami" can be particularly relevant. Traders in these markets use candlestick patterns to anticipate future price trends and volatility. The flexibility of candlestick analysis allows traders in futures and options to adapt to different market conditions, whether aiming for short-term gains or positioning for longer-term trends.
Types of Candlestick Patterns
There are different types of candlestick patterns E.g. single, double and triple candlestick patterns. Following are the list of some candlestick patterns:
1. Single Candlestick patterns
- Doji
- Hammer
- Inverted Hammer
- Shooting Star
- Spinning Top
- Dragonfly Doji
- Gravestone Doji
- Long-legged Doji
- Marubozu
2. Double Candlestick Patterns
- Bullish Engulfing Pattern
- Bearish Engulfing Pattern
- Harami Pattern
- Dark Cloud Cover
- Piercing Pattern
- Tweezer Top
- Tweezer Bottom
3. Triple Candlestick patterns
- Morning Star
- Evening Star
- Three White Soldiers
- Three Black Crows
Conclusion
In the financial markets, a solid understanding of candlestick patterns serves as a beacon for traders navigating the complexities of price movements. Through this comprehensive overview, beginners have gained insights into the fundamental aspects of candlesticks, from their historical evolution to their application in diverse markets. Recognizing the significance of identifying trend reversals, spotting trend continuations, and understanding the impact of pattern size and time-frame lays a robust foundation for practical chart analysis.
As traders embark on their journey, armed with the knowledge of candlestick patterns, it becomes evident that these visual cues are not mere fluctuations in price but rather a language through which the market communicates. The ability to read this language provides a strategic advantage, allowing traders to make informed decisions, time entries and exits with precision, and manage risk effectively.
While this overview has laid the groundwork, the realm of candlestick patterns is vast and continually evolving. In the upcoming articles, we will explore specific patterns in greater detail, exploring their nuances and applications in various market scenarios. Each article will guide traders eager to refine their analytical skills, from advanced single candlestick patterns to intricate multi-candle formations.
Stay tuned as we unravel the intricacies of candlestick patterns, providing practical insights and real-world examples to empower you to navigate the markets confidently. As we embark on this journey together, let the art of reading candlesticks become a powerful ally in your trading toolkit, unlocking the doors to potential opportunities and informed decision-making.