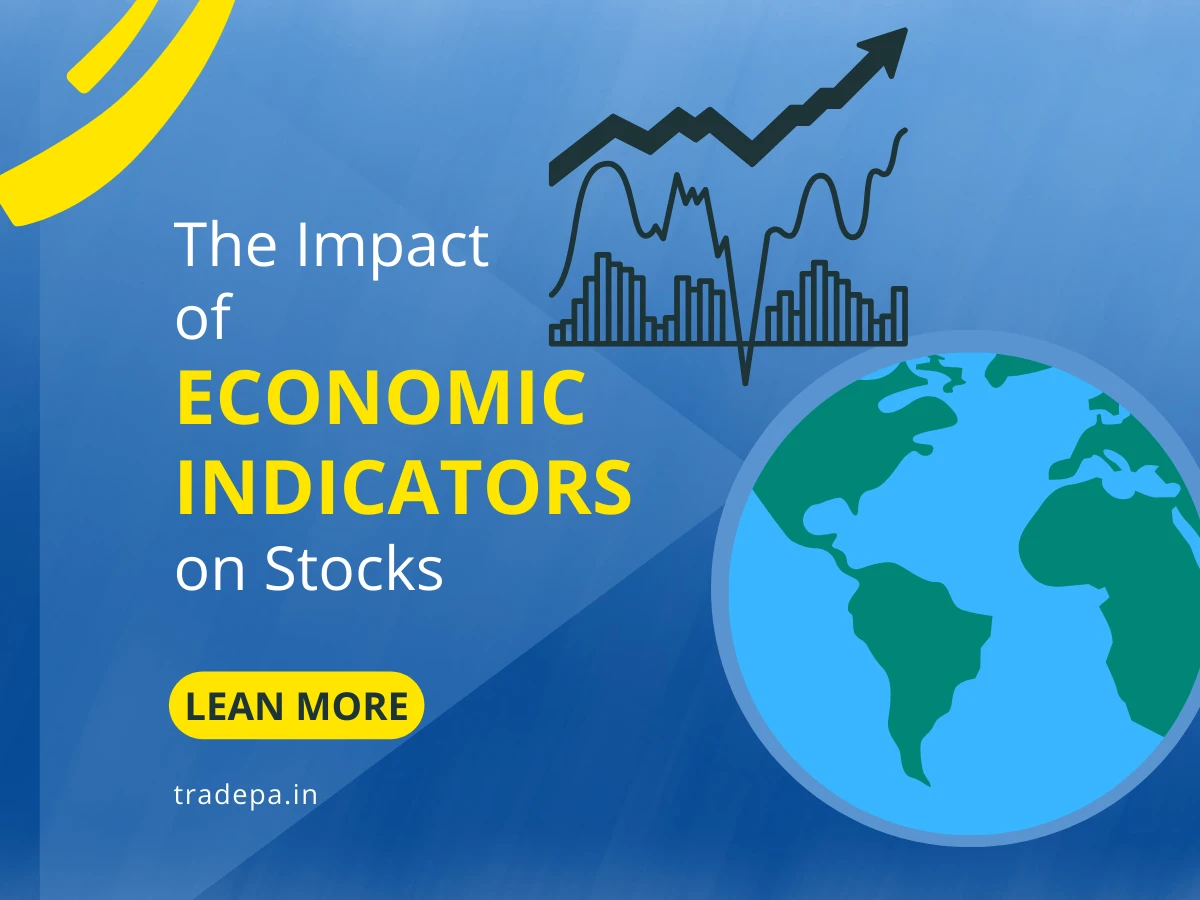
The Impact of Economic Indicators on Stocks
Understanding the stock markets is like stepping into a bustling city with its language and rhythm. At its core, the stock market is where investors buy or sell shares of publicly traded companies. But beyond this basic definition lies a complex ecosystem influenced by numerous factors. This article aims to simplify this intricate landscape for beginners, providing a roadmap to grasp the fundamental dynamics of the stock market.
Before diving into the nuances, it’s crucial to comprehend the essential workings of the stock market. Shares represent ownership in a company, and their prices fluctuate based on supply and demand. Investors’ perceptions of a company’s performance, industry trends, economic factors, and geopolitical events influence these fluctuations. The market operates on the principle of buying low and selling high, hoping that stock prices will increase over time. This section will break down these concepts into digestible bits, offering a foundational understanding of how the stock market functions.
The Role of Economic Indicators in Stock Market Performance
Economic indicators act as signposts, offering insights into the economy’s health. These indicators are like weather forecasts for the financial world, providing essential information to investors. Key indicators include GDP (Gross Domestic Product), unemployment rates, inflation measures like the Consumer Price Index (CPI), and interest rates. Understanding these indicators is vital because they directly impact stock prices. For instance, a strong GDP growth rate often correlates with a positive stock market performance, while rising unemployment rates might lead to market downturns. This segment will focus on demystifying these economic indicators and explaining how they influence stock market movements, giving beginners a clearer picture of this crucial relationship.
Key Economic Indicators
1. Gross Domestic Product (GDP)
GDP is a yardstick measuring a country’s economic health, encompassing the total value of goods and services produced within its borders. As a beginner in the stock market, understanding GDP helps gauge the overall economic performance. A rising GDP generally indicates a thriving economy, increasing production and consumption. Conversely, a declining GDP might signal an economic slowdown or recession. Investors keen on the stock market watch GDP reports to anticipate economic shifts, aligning their investment strategies accordingly.
GDP exerts a profound influence on stock market trends. Positive GDP growth often translates to rising corporate profits and increased consumer spending, boosting stock prices. Investors exhibit confidence and optimism during robust GDP growth, leading to a bullish market sentiment. Conversely, a contracting GDP might instigate market volatility and a bearish outlook. By comprehending the correlation between GDP and stock market behavior, beginners can better understand market movements and make informed investment decisions.
2. Unemployment Rate
The unemployment rate is a barometer reflecting the job market's health within an economy. When unemployment rates are low, it typically signifies a robust job market, increased consumer confidence, and higher spending, which often translates to a positive impact on stock prices. Conversely, high unemployment rates can signal economic distress, reducing consumer spending and potentially lowering corporate profits, affecting stock market performance.
Looking back at historical data unveils intriguing correlations between unemployment rates and stock market behavior. Patterns emerge, showcasing how stock markets react to varying unemployment scenarios. For instance, during periods of high unemployment, the stock market may experience increased volatility, with investors responding to uncertainties about future economic conditions. Exploring these historical trends enables beginners to comprehend the cyclical nature of market responses to unemployment rates, aiding their understanding of potential market movements in similar scenarios.
3. Consumer Price Index (CPI)
The Consumer Price Index (CPI) plays a critical role in measuring inflation and monitoring alterations in the costs of goods and services typically bought by consumers. Understanding CPI is pivotal for investors as it provides valuable insights into the buying power of consumers and the overall inflationary pressures within an economy. Rising CPI figures indicate inflationary tendencies, potentially leading to increased production costs for companies and influencing consumer spending patterns.
CPI acts as a mirror reflecting inflationary pressures, affecting stock reactions. Inflation can erode the actual value of money, impacting corporate earnings, interest rates, and consumer behavior, thereby influencing stock prices. Companies may face challenges in maintaining profitability during periods of high inflation, causing stock prices to fluctuate. Investors often scrutinize CPI reports to gauge potential shifts in monetary policy by central banks, as these policy changes can impact interest rates and stock market performance.
4. Interest Rates
Interest rates, set by central banks, are pivotal in influencing stock market volatility. When interest rates rise, borrowing costs for businesses and consumers increase. This can lead to: -
- reduced corporate profits
- decreased consumer spending
- lower stock prices.
Conversely, lower interest rates stimulate borrowing and spending, potentially boosting corporate earnings and stock prices. Understanding this relationship between interest rates and stock market volatility equips beginners with insights into the market's reactions to changes in borrowing costs, aiding in informed investment decisions.
The Federal Reserve (often called the Fed) wields significant influence over interest rates through its monetary policy decisions. Announcements or indications by the Fed about potential changes in interest rates can swiftly impact market sentiment. Investors closely monitor the Fed's decisions as they signal the central bank's perception of the economy. A decision to raise rates might indicate confidence in economic growth but could also trigger market adjustments. Conversely, lowering rates might signal concerns about economic slowdown or inflation, prompting specific market responses.
The Market Reaction
A. Short-Term Fluctuations vs. Long-Term Trends
Economic indicators wield immediate influence upon their release, triggering swift reactions in the stock market. Markets respond rapidly to unexpected changes or variations in these indicators, often leading to short-term volatility. For instance, if a significant economic indicator deviates significantly from market expectations, it can cause abrupt movements in stock prices. Investors and traders keenly watch these initial responses to capitalize on short-term opportunities or hedge against immediate risks.
While immediate responses are notable, the lasting impact of economic indicators unfolds over the long term, shaping market trends and investor sentiments. Fundamental shifts in economic indicators can set the trajectory for market behavior in the months or years ahead. For instance, sustained positive GDP growth or consistently low unemployment rates can contribute to prolonged bullish market sentiments.
Understanding this distinction between short-term fluctuations and long-term trends empowers beginners to discern between transient market movements and more enduring shifts influenced by economic indicators, aiding in crafting informed investment strategies.
B. Sector-Specific Influence
Economic indicators impact industries differently, leading to varied responses across sectors. For instance, a rise in interest rates might negatively affect interest rate-sensitive sectors like real estate but could positively impact financial sectors. Understanding these sector-specific nuances is crucial for investors. Some industries thrive during periods of high inflation, while others struggle.
Examining historical case studies unveils sector resilience and vulnerability concerning economic indicators. Analyzing how specific sectors weathered economic storms or capitalized on favorable indicators offers valuable lessons for investors. For example, healthcare sectors might exhibit resilience during high unemployment, while discretionary consumer goods sectors might experience declines.
Investor Strategies and Economic Indicators
How Investors Use Indicators for Portfolio Adjustments
Economic indicators serve as guiding beacons for investors, influencing crucial portfolio adjustments. Investors analyze these indicators to discern potential economic shifts, adjusting their portfolios accordingly. For instance, if indicators suggest an upcoming economic downturn, investors might opt for defensive stocks or assets less impacted by market volatility. Conversely, during periods of economic growth, they might favor growth-oriented investments.
Timing Investments with Economic Indicator Insights
Timing is critical in investing, and economic indicators provide vital insights for optimal investment timing. Investors keen on maximizing returns often use indicator insights to enter or exit markets strategically. For example, anticipating changes in interest rates or inflation trends can prompt investors to adjust their positions to capitalize on potential market movements.
Identifying Risks through Economic Indicators
Economic indicators are instrumental in identifying and evaluating potential risks within investment portfolios. Investors can anticipate and assess various risks by monitoring GDP growth, inflation rates, and employment figures. For instance, high inflation might risk fixed-income investments, while a slowing GDP growth rate could impact corporate earnings and stock values. Understanding how economic indicators signal these risks enables investors, especially beginners, to proactively evaluate and manage potential portfolio vulnerabilities.
Hedging Strategies Based on Indicator Trends
Hedging against risks identified through economic indicators is a prudent approach for investors. Using indicator trends as signals, investors can employ hedging strategies to mitigate potential losses. For example, suppose indicators forecast market volatility due to economic uncertainties. In that case, investors might hedge their positions by diversifying into less volatile assets or using financial instruments like options or futures contracts. Exploring these hedging strategies aligned with indicator trends equips beginners with risk-mitigation tools, enhancing their ability to navigate the market’s uncertainties effectively.
Case Studies and Historical Perspectives
Studying past events unveils significant market responses to economic indicators. Historical moments like the 2008 financial crisis or the dot-com bubble burst highlight how indicators triggered substantial market shifts. For instance, rising unemployment rates and housing market collapses during the financial crisis led to severe market downturns. Understanding these notable events and their correlations with economic indicators provides invaluable insights into how markets react to specific economic conditions.
Lessons from historical data serve as guiding lights for investors today. Analyzing how economic indicators influenced past market behaviors allows for informed decision-making in the current landscape. By drawing parallels between historical scenarios and present economic indicators, investors gain perspectives on potential market trajectories. For instance, studying how interest rate hikes impacted markets in the past aids in anticipating similar reactions in the current market.
The Global Economy and Stock Market Interplay
Impact of Global Indicators on Stocks
Global economic indicators wield a profound influence on stock markets worldwide. Global GDP trends, international trade figures, and currency exchange rates collectively impact stock performances across borders. For instance, disruptions in global trade might affect multinational companies, reflecting their stock prices across various stock exchanges. Understanding how these global indicators interconnect with stock markets enables investors to comprehend the broader economic landscape and anticipate potential impacts on their investments.
Cross-Border Market Dependencies
Stock markets today exhibit intricate interdependencies across borders. Economic events in one country can trigger ripple effects in markets worldwide. For instance, a financial crisis in one region can instigate market volatility globally. Understanding these cross-border market dependencies is crucial for investors, especially in an increasingly interconnected global economy.
Tools for Tracking Economic Indicators
Access to reliable tools is essential for tracking economic indicators. Numerous platforms and resources offer comprehensive data and analysis on economic indicators. Websites like TradingView, Bloomberg, and Yahoo Finance provide users access to real-time economic data, charts, and analysis. Economic calendars from sources like Investing.com or Forex Factory offer schedules of upcoming indicator releases. Understanding and utilizing these tools can empower investors to stay updated with crucial economic data, enabling informed decision-making in the stock market.
Real-time analysis of economic indicators is paramount for investors seeking timely insights. Tools like CNBC's Market Data provide live updates and analysis on indicator releases, allowing investors to gauge immediate market reactions. Financial news platforms such as Reuters or Financial Times offer expert interpretations of economic data, helping investors understand the potential implications on stock markets.
Challenges and Controversies
1. Reliability and Accuracy
Critiques often surface regarding the predictability and reliability of economic indicators. Some skeptics argue that indicators may not always accurately forecast market movements due to various factors such as data revisions, methodological changes, or unexpected external events. Critics suggest that relying solely on indicators might oversimplify market dynamics. Exploring these critiques provides a nuanced view for investors, prompting a cautious approach when interpreting indicator-driven predictions.
Addressing inaccuracies and misinterpretations surrounding economic indicators is crucial. Sometimes, indicators might not align with market expectations or could be misinterpreted, leading to erroneous investment decisions. Strategies to mitigate these risks include:
- Cross-referencing multiple indicators.
- Considering broader economic contexts.
- Acknowledging the margin of error within these indicators.
2. Behavioral Economics and Indicator Influence
Behavioral economics plays a pivotal role in how investors respond to economic data. Human emotions and biases often influence investment decisions, sometimes leading to irrational market behaviors. For instance, investors might exhibit herd mentality, following market trends driven by emotional reactions to economic indicators rather than objective analysis. Understanding these psychological aspects helps investors recognize and potentially counteract emotional biases when interpreting economic data.
Emotions significantly impact stock market reactions to economic indicators. Fear, greed, and overreaction to indicator releases can cause market volatility or bubbles. Emotional responses to economic data might lead to exaggerated market movements that do not align with fundamental economic realities.
Future Trends and Evolving Indicators
Advancements in technology bring forth innovative metrics and tools that offer a deeper understanding of economic landscapes. New indicators, such as data on online consumer behavior, social media sentiment analysis, or even satellite imaging for economic activity tracking, are emerging. These evolving metrics provide alternative insights into economic trends beyond traditional indicators. Understanding and embracing these new metrics can equip investors with a more comprehensive understanding of the economy, allowing for potentially more accurate predictions and informed investment decisions.
Evolving indicators hold the potential to revolutionize how investors forecast market shifts. By harnessing big data analytics, artificial intelligence, and machine learning, these indicators can offer predictive capabilities, foreseeing market movements with greater accuracy. For instance, sentiment analysis tools that gauge public mood through social media posts could signal shifts in consumer behavior. Exploring how these evolving indicators forecast market shifts empowers investors to adapt their strategies, positioning themselves advantageously in response to changing economic landscapes.
Conclusion
Economic indicators stand as fundamental signposts guiding investors through the intricate terrain of the stock market. They offer invaluable insights into the health of economies, influencing investor sentiment, market trends, and investment decisions. From GDP and unemployment rates to inflation metrics and interest rates, these indicators weave a narrative of economic conditions, shaping the path of stock markets. Understanding their significance empowers investors to navigate the ever-changing market landscape with a more informed perspective.
As we move forward, the dynamics of economic indicators will continue evolving, introducing new challenges and opportunities for investors. Adapting to these changes is paramount for successful investing. Embracing emerging indicators, leveraging advanced tools, and acknowledging the limitations and biases surrounding indicators will be crucial. Continuous learning, flexibility in investment strategies, and a nuanced understanding of the interplay between economic indicators and market behavior will remain vital in navigating the complexities of the stock market.
In summary, economic indicators are vital compasses in the vast financial markets, guiding investors in making informed decisions. Their role is not just about interpreting data; it’s about understanding the stories they tell, preparing investors to navigate uncertainties, and adapting to the ever-evolving dynamics of the global economy.